

The market has rather on a roller-coaster for the past few weeks. We have seen most of the alt tokens gain and lose valuation. Steem can be seen as one of them. Today we will see steem price movements and reflect on how it has fared.

The week started with Steem gradual rise towards the resistance level of 0.124$ and then getting rejected that level. It was a rather strong resistance level. Unfortunately, for the next period, Steem gradually fell and lost key support levels suddenly.
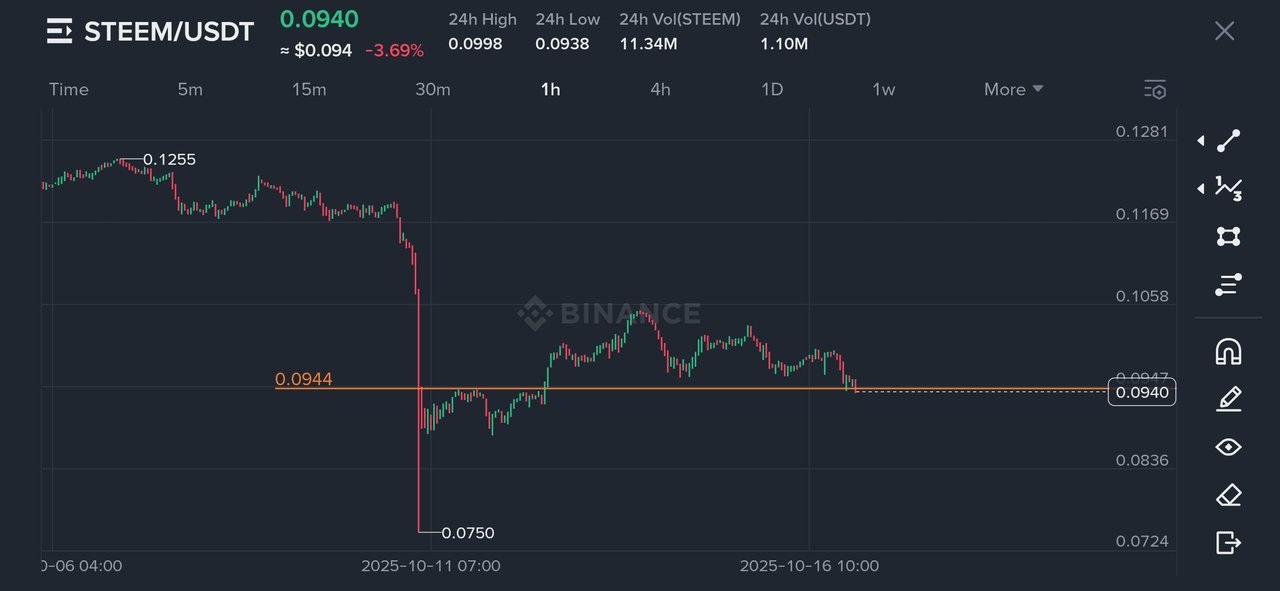
Steem fell through the level of 0.0944$ quickly. On the upper part, this 0.10$ zone is now a crucial level for it. It has created a bearish trendline over the last week, that needs to be broken through. Steem needs to regain the strong resistance zone, with a successful retest. There will be 0.11$ zone ahead of Steem after that.
All Screenshots are taken from Coingecko
After experiencing a few good weeks, Steem is currently showing bad performance. It is down 20.5% in a week.
No word from this article should be taken as financial advice.

 30.126 SRY